
Management Information System, Directorate General of Health Services, Mohakhali, Dhaka-1212
Annual MIS Conference Presentation 2024
Venue: Kaisar Rahman Memorial Auditorium, Rajshahi Medical College, Rajshahi.

Date :18th April, 2024
Integrated Health Information for Smart Bangladesh

Objective of the Conference
| Serial | Yearly HMIS Performance review |
|---|---|
| 01 | Comparison of Data (2022 & 2023) |
| 02 | Identify Errors & Check Data Quality |
| 03 | Ranking Higher & lower Performing CC (3) |
01 of 24
Timeliness of Reporting Rate
| Serial | Topic | 2022 | 2023 |
|---|---|---|---|
| 01 | OPD and Emergency Visits, Admission Data Set | 100% | 100% |
| 02 | Hospital Bed Statement | 100% | 100% |
| 03 | Hospital Service and User Fee | 100% | 100% |
| 04 | EmONC Data Set with Genital Fistula | 100% | 100% |
| 05 | IMCI Dataset New | 100% | 100% |
| 06 | Major Equipment Information | 100% | 100% |
| 07 | HMC meeting | 100% | 100% |
| 08 | EPI Infant and Women Data set (Form-1&2) | 100% | 100% |
| 09 | Oxygen Management | 100% | 100% |
Comparison of Hospital Aggregated & Individual Patient’s Data
| Serial | Topic | 2022 | 2023 |
|---|---|---|---|
| 01 | Admission Patients | 9,289 | 11,261 |
| 02 | Total admission reported individually | 100% | 100% |
| 03 | Percentage of Total admission reported individually | 100% | 100% |
| 04 | Total Live birth | (November & December) =73 | 390 |
| 05 | Total No. of Birth Notification Sent | (November & December) =0 | 19 |
03 of 24
Hospital Indoor Patients Outcome & Percentage (%)
| Serial | Topic | 2023 | Percentage with Total Outcome |
|---|---|---|---|
| 01 | Improved & discharged with advice | 5010 | 44.50% |
| 02 | Discharge on request (DOR) | 3587 | 31.85% |
| 03 | Discharge on risk bond (DORB) | 607 | 5.39% |
| 04 | Absconded | 940 | 8.35% |
| 05 | Referred or Transferred | 1103 | 9.79% |
| 06 | Expired / Died | 13 | 0.11% |
| 07 | Uncategorized | 1 | 0.01% |
| 08 | Total Outcome | 11261 | 100% |
04 of 24
Quality of Hospital Indoor Patients Capture Data (Top 20 duration days out of Total Individuals Entry)
| Serial | Registration No | Age | Sex | Date of admission | Date of discharge/death | Main Diagnosis | Duration (Days) of hospital stay |
|---|---|---|---|---|---|---|---|
| 01 | 19013/106 | 35 | F | 2023-08-29 00:00:00.0 | 2023-09-14 00:00:00.0 | D171 Benign lipomatous neoplasm of skin and subcutaneous tissue of trunk | 16 |
| 02 | 4991/62 | 18 | F | 2023-03-13 00:00:00.0 | 2023-03-28 00:00:00.0 | R53 Malaise and fatigue | 15 |
| 03 | 11612/26 | – | M | 2023-06-14 00:00:00.0 | 2023-06-29 00:00:00.0 | E440 Moderate protein-energy malnutrition | 15 |
| 04 | 1159/05 | 1 | F | 2023-06-14 00:00:00.0 | 2023-06-29 00:00:00.0 | E43 Unspecified severe protein-energy malnutrition | 15 |
| 05 | 1295/06 | 1 | M | 2023-06-14 00:00:00.0 | 2023-06-29 00:00:00.0 | E43 Unspecified severe protein-energy malnutrition | 15 |
| 06 | 28146/73 | 1 | F | 2023-11-13 00:00:00.0 | 2023-11-28 00:00:00.0 | E440 Moderate protein-energy malnutrition | 15 |
| 07 | 28147/74 | 1 | F | 2023-11-13 00:00:00.0 | 2023-11-28 00:00:00.0 | E43 Unspecified severe protein-energy malnutrition | 15 |
| 08 | 30575/23 | 30 | M | 2023-12-12 00:00:00.0 | 2023-12-27 00:00:00.0 | V099 Pedestrian injured in unspecified transport accident | 15 |
| 09 | 7713/30 | 80 | M | 2023-04-23 00:00:00.0 | 2023-05-07 00:00:00.0 | R53 Malaise and fatigue | 14 |
| 10 | 23536/32 | – | F | 2023-10-01 00:00:00.0 | 2023-10-15 00:00:00.0 | E43 Unspecified severe protein-energy malnutrition | 14 |
| 11 | 28196/30 | 1 | F | 2023-11-14 00:00:00.0 | 2023-11-28 00:00:00.0 | E43 Unspecified severe protein-energy malnutrition | 14 |
| 12 | 30226/24 | – | F | 2023-12-07 00:00:00.0 | 2023-12-21 00:00:00.0 | E441 Mild protein-energy malnutrition | 14 |
| 13 | 1148/59 | – | – | 2023-01-22 00:00:00.0 | 2023-02-04 00:00:00.0 | P071 Other low birth weight | 13 |
| 14 | 946/05 | – | F | 2023-04-16 00:00:00.0 | 2023-04-29 00:00:00.0 | E43 Unspecified severe protein-energy malnutrition | 13 |
| 15 | 29322/59 | 60 | F | 2023-11-26 00:00:00.0 | 2023-12-09 00:00:00.0 | R53 Malaise and fatigue | 13 |
| 16 | 3282/12 | 45 | M | 2022-12-24 00:00:00.0 | 2023-01-05 00:00:00.0 | M613 Calcification and ossification of muscles associated with burns | 12 |
| 17 | 1624/11 | 1 | M | 2023-02-01 00:00:00.0 | 2023-02-13 00:00:00.0 | J129 Viral pneumonia, unspecified | 12 |
| 18 | 2665/48 | 45 | F | 2023-02-15 00:00:00.0 | 2023-02-27 00:00:00.0 | H814 Vertigo of central origin | 12 |
| 19 | 2900/35 | 1 | F | 2023-02-14 00:00:00.0 | 2023-02-26 00:00:00.0 | E43 Unspecified severe protein-energy malnutrition | 12 |
| 20 | 29157/42 | 30 | F | 2023-11-24 00:00:00.0 | 2023-12-06 00:00:00.0 | O47 False labour | 12 |
Quality of Hospital Indoor Patients Capture Death Data
| Serial | Top 15 Causes of Death | ICD10 Code | Number of Death |
|---|---|---|---|
| 01 | Cardiorespiratory Arrest | I469 | 1 |
| 02 | Cardiorespiratory Arrest | I469 | 1 |
| 03 | Cardiorespiratory Arrest | I469 | 1 |
| 04 | Cardiorespiratory Arrest | I469 | 1 |
| 05 | Cardiorespiratory Arrest | I469 | 1 |
| 06 | Cardiorespiratory Arrest | I469 | 1 |
| 07 | Cardiorespiratory Arrest | I509 | 1 |
| 08 | Cardiorespiratory Arrest | I509 | 1 |
| 09 | Cardiorespiratory Arrest | I509 | 1 |
| 10 | Cardiorespiratory Arrest | I509 | 1 |
| 11 | Cardiorespiratory Arrest | I509 | 1 |
| 12 | Cardiorespiratory Arrest | I509 | 1 |
| 13 | Uncategorized | – | 1 |
| 14 | – | – | – |
| 15 | – | – | – |
| Total Death | – | – | 13 |
Medical Certification of Causes of Death (MCCoD) & SMOL Data Entry Percentage
| Serial | Topic | 2022 | 2023 |
|---|---|---|---|
| 01 | No. of Death | 7 | 13 |
| 02 | Total death (MCCoD) | 7 | 13 |
| 03 | SMoL Entry % | 100% | 100% |
| 04 | No. of Death Notification Sent | 0 | 0 |
07 of 24
Top 15 Underlying Causes of Death (MCCoD)
| Serial | Top 15 Underlying Causes of Death | ICD10 Code | Number of Death |
|---|---|---|---|
| 01 | Other heart diseases | I469 | 1 |
| 02 | Other heart diseases | I469 | 1 |
| 03 | Other heart diseases | I469 | 1 |
| 04 | Other heart diseases | I469 | 1 |
| 05 | Other heart diseases | I469 | 1 |
| 06 | Other heart diseases | I469 | 1 |
| 07 | Other heart diseases | I509 | 1 |
| 08 | Other heart diseases | I509 | 1 |
| 09 | Other heart diseases | I509 | 1 |
| 10 | Other heart diseases | I509 | 1 |
| 11 | Other heart diseases | I509 | 1 |
| 12 | Other heart diseases | I509 | 1 |
| 13 | Uncategorized | – | 1 |
| 14 | – | – | – |
| 15 | – | – | – |
| Total Death | – | – | 13 |
Normal Delivery status with respective to Previous Year
| Number of Normal Deliveries in 2022 | Target 2023 | Number of Normal Deliveries in 2023 | Achievement Status (Achieved or Not Achieved) |
|---|---|---|---|
| 352 | 369 | 322 | Not Achieved |
09 of 24
Data accuracy of EmOC Report Year, 2022 & 2023
| Serial | Topic | 2022 | 2023 |
|---|---|---|---|
| 01 | Total Delivery | 386 | 391 |
| 02 | Normal Delivery | 352 | 322 |
| 03 | Forceps Delivery | 0 | 0 |
| 04 | Breech Delivery | 0 | 0 |
| 05 | Delivery by C-Section | 34 | 69 |
| 06 | Live births | 385 | 390 |
| 07 | Still birth (Fresh) | 1 | 1 |
| 08 | Still birth (Macerated) | 0 | 0 |
| 09 | Delivery Status ** | 385 | 390 |
| 10 | Outcome Status *** | 386 | 391 |
***Outcome Status = True if (Total outcome >=Live births +Still + Macerate) otherwise False.
10 of 24
IMCI-N Corner services reporting status
| Serial | Topic | 2022 | 2023 |
|---|---|---|---|
| 01 | IMCI_Under Weight | 118 | 162 |
| 02 | IMCI_Wasting | 119 | 93 |
| 03 | IMCI_Stunting | 143 | 179 |
| 04 | IMCI_SAM | 12 | 13 |
11 of 24
Hospital Bed Statement
| Serial | 2022 | 2023 | |
|---|---|---|---|
| 01 | Total Admission Patients | 9,285 | 11,261 |
| 02 | Total Patient Days | 18,487 | 21,225 |
| 03 | Bed Occupancy Rate | 101.8 | 116.2 |
| 04 | Average Length of Stay | 1.9 | 2 |
| 05 | Hospital Death Rate (Adult + Neonatal) | 0.08% | 0.12% |
12 of 24
Hospital User Fees
| Serial | Topic | 2022 | 2023 |
|---|---|---|---|
| 01 | Out Patient User Fee | 3,85,539/- | 6,89,359/- |
| 02 | Indoor Patient User Fee | 5,299/ | 98,000/- |
| 03 | Emergency Patient User Fee | 1,29,458/- | 1,53,070/- |
| 04 | Laboratory User Fee | 6,50,855/- | 12,01,980/- |
| 05 | X-Ray User Fee | – | 4,29,350/- |
| 06 | Ultrasonography User Fee | – | 1,04,130/- |
| 07 | ECG User Fee | 81,240/- | 1,20,720/- |
| 08 | Ambulance User Fee | 5,54,400/- | 4,75,500/- |
| 09 | Total Collected User Fee | 18,06,791/- | 32,72,109/- |
13 of 24
Cervical & Breast Cancer Surveillance System
| Serial | Topic | 2022 | 2023 |
|---|---|---|---|
| 01 | Total Number of Registration | 1519 | 11226 |
| 02 | Total VIA Performed | 1187 | 1692 |
| 03 | Total VIA +Ve | 8 | 9 |
| 04 | Total Clinical Breast Examination (CBE) Performed | 1183 | 1698 |
| 05 | Total Clinical Breast Examination (CBE) +Ve | 2 | 3 |
14 of 24
Community MPDSR Presentation
| Serial | Topic | Maternal Death in 2022 | Maternal Death in 2023 | Perinatal Death in 2022 | Perinatal Death in 2023 |
|---|---|---|---|---|---|
| 01 | Estimated Number Maternal Death | 0 | 0 | 0 | 0 |
| 02 | Number of Maternal Death Reported by Health Assistants (HA) | 0 | 0 | 0 | 0 |
| 03 | Notified by Community Health Care Providers (CHCP) (DHIS2) | 0 | 0 | 0 | 0 |
| 04 | Review at Community (DHIS2) | 0 | 0 | 0 | 0 |
15 of 24
Facility level MPDSR Presentation
| Serial | Topic | 2022 | 2023 |
|---|---|---|---|
| 01 | Neonatal Death | 0 | 0 |
| 02 | Neonatal Death Review | 0 | 0 |
| 03 | Maternal Death | 0 | 0 |
| 04 | Maternal Death Review | 0 | 0 |
16 of 24
Presentation on Immunization
| Serial | Topic | Percentage (%) in 2022 | Percentage (%) in 2023 |
|---|---|---|---|
| 01 | BCG Crude Coverage | 101.2 | 101 |
| 02 | Penta1 Crude Coverage | 106.4 | 99.6 |
| 03 | Penta3 Crude Coverage | 101.8 | 94.1 |
| 04 | MR1 Crude Coverage | 103.5 | 99.2 |
| 05 | MR2 Crude Coverage | 98.5 | 98.3 |
| 06 | BCG Left Out Rate | -1.2 | -1 |
| 07 | BCG to Penta3 Drop out Rate | -0.56 | 6.9 |
| 08 | BCG to MR1 Drop out Rate | -2.2 | 1.8 |
17 of 24
AFP Surveillance, MR Surveillance, Neonatal Tetanus Surveillance
| Serial | Topic | 2022 | 2023 |
|---|---|---|---|
| 01 | Acute Flaccid Paralysis (AFP) | 2 | 2 |
| 02 | Measles | 6 | 6 |
| 03 | Neonatal Tetanus (NT) | 0 | 0 |
18 of 24
Child DLI14.4 Last 12 Months’ Presentation-19
| Serial | Percentage of 0-<6 Month Children Received Breast Feeding Counselling | 2022 | 2023 |
|---|---|---|---|
| 01 | January | 29.3 | 47.2 |
| 02 | February | 33.3 | 63.1 |
| 03 | March | 54.2 | 66.7 |
| 04 | April | 44.8 | 58.8 |
| 05 | May | 64.7 | 63.3 |
| 06 | June | 36.8 | 75.4 |
| 07 | July | 51.9 | 75.9 |
| 08 | August | 58.1 | 79.5 |
| 09 | September | 73.3 | 87.7 |
| 10 | October | 72.5 | 85 |
| 11 | November | 58.3 | 68.3 |
| 12 | December | 58.7 | 70.1 |
Percentage of 6-23 Month Children Counselled on Complementary Feeding
| Serial | Percentage of 6-23 Month Children Counselled on Complementary Feeding | 2022 | 2023 |
|---|---|---|---|
| 01 | January | 186.7 | 116.4 |
| 02 | February | 242.1 | 119.8 |
| 03 | March | 110.5 | 119.8 |
| 04 | April | 219 | 144.6 |
| 05 | May | 150 | 183.9 |
| 06 | June | 200 | 243.8 |
| 07 | July | 193.1 | 168.9 |
| 08 | August | 138.2 | 172.9 |
| 09 | September | 137.8 | 148.7 |
| 10 | October | 137 | 150.5 |
| 11 | November | 117.4 | 185.9 |
| 12 | December | 132.3 | 140.4 |
Maternal DLI13.4 Last 12 Months’ Presentation-21
| Serial | Percentage of Women who Received >= 30 IFA, Weight Measured & Counselled for Nutrition during ANC | 2022 | 2023 |
|---|---|---|---|
| 01 | January | 90.8 | 96.9 |
| 02 | February | 93.8 | 98.8 |
| 03 | March | 96.7 | 96.3 |
| 04 | April | 95.1 | 95.8 |
| 05 | May | 96.1 | 98.9 |
| 06 | June | 89 | 97.7 |
| 07 | July | 88.9 | 94.8 |
| 08 | August | 89.2 | 97.7 |
| 09 | September | 95 | 99.3 |
| 10 | October | 100 | 100 |
| 11 | November | 98.5 | 99.3 |
| 12 | December | 100 | 100 |
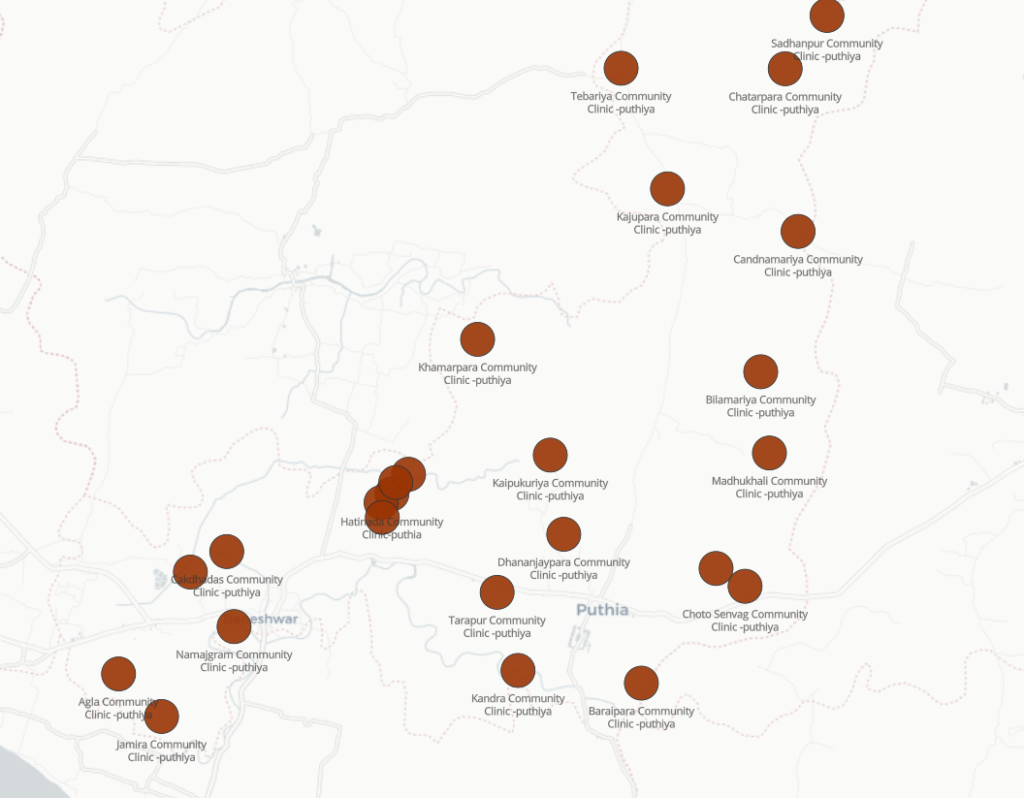
Location of Community Clinics
22 of 24
Special Innovative Idea
| Serial | Topic | Period |
|---|---|---|
| 01 | Tagging HONOURABLE FREEDOM FIGHTERs with their nearest CC to provide all necessary Medicines & Health Care services | 2023 |
| 02 | Hospital Automation including ONLINE TICKETING, e-PRESCRIPTION, Bed Distribution, Discharge & Medical Certificate Issue, Smart Store Management | 2023 |
| 03 | Online Presentation for best Accountability | 2023 |
23 of 24
HSS scores comparison of catchment area (Annex-01)
| 2023 | Puthia | Bagha | Bagmara | Charghat | Durgapur | Godagari | Mohonpur | Paba | Tanore |
|---|---|---|---|---|---|---|---|---|---|
| January | 78.87 | 78.18 | 71.58 | 75.69 | 75.07 | 69.34 | 71.44 | 82.2 | 73.01 |
| February | 78.03 | 80.12 | 74.51 | 77.24 | 75.37 | 73.5 | 72.59 | 82.34 | 75.41 |
| March | 81.13 | 78.72 | 80.71 | 77.61 | 76.58 | 71.76 | 72.87 | 77.02 | 74.6 |
| April | 83.38 | 78.25 | 84.07 | 80.3 | 75.4 | 70.09 | 74.96 | 77.7 | 69.98 |
| May | 82.2 | 78.18 | 71.29 | 81.85 | 74.54 | 68.53 | 73.55 | 79.96 | 74.99 |
| June | 81.98 | 78.54 | 72.83 | 79.72 | 76.64 | 69.13 | 74.66 | 76.7 | 77.04 |
| July | 81.82 | 81.88 | 72.53 | 82.32 | 73.75 | 71.21 | 71.55 | 76.17 | 79.07 |
| August | 84.23 | 84.23 | 77.34 | 81.6 | 74.04 | 74.38 | 72.61 | 76.98 | 76.85 |
| September | 84.21 | 84.93 | 75.61 | 80.95 | 76.47 | 70.32 | 74.63 | 74.01 | 76.18 |
| October | 84.89 | 84.76 | 81.8 | 80.81 | 80.16 | 76.65 | 78.71 | 70.48 | 74.07 |
| November | 84.06 | 83.41 | 80.19 | 82.81 | 84.75 | 77.51 | 78.6 | 73.65 | 75.74 |
| December | 81.7 | 83.43 | 80.15 | 78.18 | 83.27 | 77.79 | 73.4 | 74.94 | 78.19 |
| Total | 986.5 | 974.63 | 922.61 | 959.08 | 926.04 | 870.21 | 889.57 | 922.15 | 905.13 |
| 2023(AVG) | 82.20833333 | 81.21916667 | 76.88416667 | 79.92333333 | 77.17 | 72.5175 | 74.13083333 | 76.84583333 | 75.4275 |
24 of 24
